Glacial Ice Timeline QPOEE
NGSS Connection HS-ESS3-5
Analyze geoscience data and the results from global climate models to make an evidence based forecast of the current rate of global or regional climate change and associated future impacts to Earth systems.
Learning Objectives
• Students explain characteristics of the glacial life cycle.
• Students collect and display historical glacial ice volume on an evidence-based timeline.
• Students write an explanation that describes the effect of temperature on glacial ice volume.
KNOWLEDGE PROBE:
Day 1: CLICK ON: extremeicesurvey.org (scroll down and view the short video called, Mendenhall Glacier, Alaska at the bottom), view Melting Glaciers and view How will Earth Change if all the Ice Melts?
Assignment: In your ISN Write a paragraph on
* What changes do you see in the pictures?
* How you think the shrinking of the glacier impacts Earth.
* If you were to visit these parks 10 years from now, what would you expect to see?
ASSIGNMENT: Read this article: In Sign of Warning, 1,600 years of Ice in Andes Melted in 25 years
After reading the article
1. Write an Essential Question for this article. Read the article carefully, the title of an article does not always make a good essential question. An essential question is a broad based question that can have multiple answers.
2. Next, Make a CLAIM Ask yourself what is the author trying to say about this glacier?
3. Then, Show your EVIDENCE
Hint: you may want to create a data table to collect information from the article that supports your claim.
4. And finally, provide a REASONING as to why your evidence proves your claim. Create this on a google doc, copy the URL link and submit that link in this Schoology Assignment.
Part 2: Glacier Terms on Google Slides
Glacial Ice Project:
ESSENTIAL QUESTION:
Each small group will be assigned a different region to study using this enlarged Mapping the World’s Glaciers figure or the National Snow and Ice Data Center’s Where are glaciers located chart.
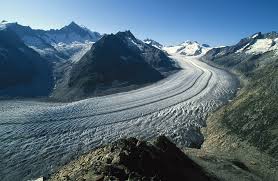
CURIOSITY: To promote curiosity, LOOK AT THESE IMAGES OF GLACIERS AND GLACIAL FEATURES images of glaciers and glacial features (below) . In your ISN ask questions about what you are seeing.
Go to this link to view the project.
Create a Google Doc for this project. Copy the Knowledge Probes assignments listed below and put all answers on this doc.
Day 1: Essential Questions:
How does the melting of sea ice impact sea level?
How is the loss of sea ice affecting arctic species?
How is the changing climate impacting sea ice's albedo?
Activity: Personal Knowledge What do you already know about glaciers?
Write each question listed below into your Google Doc In your own words, answer each question. When you all are done writing as a class we sill do a pair share with your table mates-who may or may not be a member of your team. Create bullet points for each question. Add any new facts named into your own Google Doc
What do you already know about glaciers and the effect of temperature on glaciers?
Where do glaciers exist and how do they form and change over time?
How are species impacted by changing climate?
NEXT: KNOWLEDGE PROBE #2
COPY the questions below into your Google Doc. Click on each sentence link, read the article and provide 2 things you learned about each article. Place your answers on a google doc and submit in this Schoology Assignment.
1. Write 2 things your know about how sea levels are changing.
2. Write 2 things you know about where glaciers form and how they change over time
3. Write 2 things you know about how the changing climate is impacting sea ice's albedo?
4. Write 2 things you know about how the loss of sea ice is affecting arctic species.
Be prepared to discuss this with your table mates and as a class discussion.
Read the following information:
How does global temperature affect glacial ice volume over time?
In July 2017, a block of ice the size of Delaware broke off the Larsen C Ice Shelf in Antarctica. This was the end result of the crack scientists observed in 1960 when they first photographed the thousand-foot-thick shelf of ice floating on the sea. A new trillion-ton iceberg named A-68 broke off and began floating in the Weddell Sea. Scientists observed more cracks in the iceberg and predict it will break into smaller bergs as it moves farther out to sea.
Glaciers all over the world accumulate new ice and shed old ice as seasons change. Calving, the process of an ice chunk breaking off a glacier, occurs in glaciers of all sizes, so the action itself wasn’t surprising. The timing was the concern. In 2014, the crack on Larsen C began to grow rapidly, alarming scientists. On May 31, 2017, the crack’s leading edge was 8 miles from the edge. By July 12, 2017, the crack’s 25-mile journey was complete. Was this rapid change due to rising temperatures or just a normal part of a glacier’s lifecycle? In this investigation, you will construct an evidence-based
timeline and forecast the relationship between temperature and glacial ice volume over time. You will then share your findings in a classroom gallery walk.
KNOWLEDGE PROBE #3
ACTIVITY: Day 2: View this PPT on Sea Ice. Use the worksheet to answer the questions. Make a copy of the PPT and place it on your existing Google Doc. When done submit your doc into this Schoology assignment.
KNOWLEDGE PROBE #4
Day one Activity #3
View these 3 links and when done viewing write 3 things you learned, 2 things that surprised you and one question you still have. Place the answers on your existing Google Doc then Go to this Schoology Link to submit your answers.
Alaska Satellite Facility: How do glaciers move?
AntarcticGlaciers.org: Mapping the World’s Glaciers National Snow and
Ice Data Center: Where are glaciers located?
Day 2 Activity: I'm going to place you into groups of 3. Each member of your group will be assigned one of the Essential Questions to research. you will be constructing the CLAIM, EVIDENCE AND REASONING of a QPOEE Report. You will be conducting a lot of Google Searches to find the data you will need to provide Evidence for your Claim. You will also be researching the Scientific reasons, theories or beliefs that provide an explanation as to why your Evidence proves your Claim.
How to write a Claim; The claim is a statement that provides the researcher's answer to the essential question investigated. It will be a short one sentence, to the point answer to the EQ. You will receive points if the claim actually answers the EQ.
How to construct EVIDENCE: Evidence is the scientific data selected to support the claim. Scientific data is data or information that can be gathered through first-hand investigations, observations (qualitative and/or quantitative), and/or archived (researched) data.
You will be trying to find QUANTITATIVE OBSERVATIONS already made by other researchers. This means you will attempt to obtain data tables and graphs that SPECIFICALLY support your claim. You will need to find 4 graphs and or data tables for this project. For each data table/graph you will provide DATA ANALYSIS of the information presented. This analysis will be in paragraph form and will summarize the information presented. You will also identify any patterns or trends that will help explain the data. Each graph will have to have a web address attached to cite where you got the information.
How to construct REASONING: Reasoning is the argument used to determine why the selected data should count as evidence. The argument should include the following:
* personal prior knowledge (look at information you learned from all the Knowledge Probes)
* scientific concepts, principles or theories
* secondary resources ie. Internet, magazines, books etc.
Make sure that the reasoning links the claim to the evidence. Make sure that the reasoning justifies WHY the evidennce supports the claim.
BIBLIOGRAPHY: Scientists must always cite work they have not written or researched themselves. At the end of your report you should include the following information on all cites you used.
1. The title of the article
2. The author of the article
3. The name of the publication and dates the article was printed
4. The web address of the article
Glaciers:
1. South America 25,500 square kilometers (9,846 square miles)
2. Northern Asia 59,600 square kilometers (23,012 square miles)
3. Antarctica (not including the main ice sheets)77,000 square kilometers (29,730 square miles)
4. Central Asia 114,800 square kilometers (44,325 square miles)
5. North America 124,000 square kilometers (47,877 square miles)
6. Arctic Islands (not including the Greenland Ice Sheet)275,500 square kilometers (106,371 square miles)
Day 1: CLICK ON: extremeicesurvey.org (scroll down and view the short video called, Mendenhall Glacier, Alaska at the bottom), view Melting Glaciers and view How will Earth Change if all the Ice Melts?
Assignment: In your ISN Write a paragraph on
* What changes do you see in the pictures?
* How you think the shrinking of the glacier impacts Earth.
* If you were to visit these parks 10 years from now, what would you expect to see?
ASSIGNMENT: Read this article: In Sign of Warning, 1,600 years of Ice in Andes Melted in 25 years
After reading the article
1. Write an Essential Question for this article. Read the article carefully, the title of an article does not always make a good essential question. An essential question is a broad based question that can have multiple answers.
2. Next, Make a CLAIM Ask yourself what is the author trying to say about this glacier?
3. Then, Show your EVIDENCE
Hint: you may want to create a data table to collect information from the article that supports your claim.
4. And finally, provide a REASONING as to why your evidence proves your claim. Create this on a google doc, copy the URL link and submit that link in this Schoology Assignment.
Part 2: Glacier Terms on Google Slides
Glacial Ice Project:
ESSENTIAL QUESTION:
Each small group will be assigned a different region to study using this enlarged Mapping the World’s Glaciers figure or the National Snow and Ice Data Center’s Where are glaciers located chart.
CURIOSITY: To promote curiosity, LOOK AT THESE IMAGES OF GLACIERS AND GLACIAL FEATURES images of glaciers and glacial features (below) . In your ISN ask questions about what you are seeing.
Go to this link to view the project.
Create a Google Doc for this project. Copy the Knowledge Probes assignments listed below and put all answers on this doc.
Day 1: Essential Questions:
How does the melting of sea ice impact sea level?
How is the loss of sea ice affecting arctic species?
How is the changing climate impacting sea ice's albedo?
Activity: Personal Knowledge What do you already know about glaciers?
Write each question listed below into your Google Doc In your own words, answer each question. When you all are done writing as a class we sill do a pair share with your table mates-who may or may not be a member of your team. Create bullet points for each question. Add any new facts named into your own Google Doc
What do you already know about glaciers and the effect of temperature on glaciers?
Where do glaciers exist and how do they form and change over time?
How are species impacted by changing climate?
NEXT: KNOWLEDGE PROBE #2
COPY the questions below into your Google Doc. Click on each sentence link, read the article and provide 2 things you learned about each article. Place your answers on a google doc and submit in this Schoology Assignment.
1. Write 2 things your know about how sea levels are changing.
2. Write 2 things you know about where glaciers form and how they change over time
3. Write 2 things you know about how the changing climate is impacting sea ice's albedo?
4. Write 2 things you know about how the loss of sea ice is affecting arctic species.
Be prepared to discuss this with your table mates and as a class discussion.
Read the following information:
How does global temperature affect glacial ice volume over time?
In July 2017, a block of ice the size of Delaware broke off the Larsen C Ice Shelf in Antarctica. This was the end result of the crack scientists observed in 1960 when they first photographed the thousand-foot-thick shelf of ice floating on the sea. A new trillion-ton iceberg named A-68 broke off and began floating in the Weddell Sea. Scientists observed more cracks in the iceberg and predict it will break into smaller bergs as it moves farther out to sea.
Glaciers all over the world accumulate new ice and shed old ice as seasons change. Calving, the process of an ice chunk breaking off a glacier, occurs in glaciers of all sizes, so the action itself wasn’t surprising. The timing was the concern. In 2014, the crack on Larsen C began to grow rapidly, alarming scientists. On May 31, 2017, the crack’s leading edge was 8 miles from the edge. By July 12, 2017, the crack’s 25-mile journey was complete. Was this rapid change due to rising temperatures or just a normal part of a glacier’s lifecycle? In this investigation, you will construct an evidence-based
timeline and forecast the relationship between temperature and glacial ice volume over time. You will then share your findings in a classroom gallery walk.
KNOWLEDGE PROBE #3
ACTIVITY: Day 2: View this PPT on Sea Ice. Use the worksheet to answer the questions. Make a copy of the PPT and place it on your existing Google Doc. When done submit your doc into this Schoology assignment.
KNOWLEDGE PROBE #4
Day one Activity #3
View these 3 links and when done viewing write 3 things you learned, 2 things that surprised you and one question you still have. Place the answers on your existing Google Doc then Go to this Schoology Link to submit your answers.
Alaska Satellite Facility: How do glaciers move?
AntarcticGlaciers.org: Mapping the World’s Glaciers National Snow and
Ice Data Center: Where are glaciers located?
Day 2 Activity: I'm going to place you into groups of 3. Each member of your group will be assigned one of the Essential Questions to research. you will be constructing the CLAIM, EVIDENCE AND REASONING of a QPOEE Report. You will be conducting a lot of Google Searches to find the data you will need to provide Evidence for your Claim. You will also be researching the Scientific reasons, theories or beliefs that provide an explanation as to why your Evidence proves your Claim.
How to write a Claim; The claim is a statement that provides the researcher's answer to the essential question investigated. It will be a short one sentence, to the point answer to the EQ. You will receive points if the claim actually answers the EQ.
How to construct EVIDENCE: Evidence is the scientific data selected to support the claim. Scientific data is data or information that can be gathered through first-hand investigations, observations (qualitative and/or quantitative), and/or archived (researched) data.
You will be trying to find QUANTITATIVE OBSERVATIONS already made by other researchers. This means you will attempt to obtain data tables and graphs that SPECIFICALLY support your claim. You will need to find 4 graphs and or data tables for this project. For each data table/graph you will provide DATA ANALYSIS of the information presented. This analysis will be in paragraph form and will summarize the information presented. You will also identify any patterns or trends that will help explain the data. Each graph will have to have a web address attached to cite where you got the information.
How to construct REASONING: Reasoning is the argument used to determine why the selected data should count as evidence. The argument should include the following:
* personal prior knowledge (look at information you learned from all the Knowledge Probes)
* scientific concepts, principles or theories
* secondary resources ie. Internet, magazines, books etc.
Make sure that the reasoning links the claim to the evidence. Make sure that the reasoning justifies WHY the evidennce supports the claim.
BIBLIOGRAPHY: Scientists must always cite work they have not written or researched themselves. At the end of your report you should include the following information on all cites you used.
1. The title of the article
2. The author of the article
3. The name of the publication and dates the article was printed
4. The web address of the article
Glaciers:
1. South America 25,500 square kilometers (9,846 square miles)
2. Northern Asia 59,600 square kilometers (23,012 square miles)
3. Antarctica (not including the main ice sheets)77,000 square kilometers (29,730 square miles)
4. Central Asia 114,800 square kilometers (44,325 square miles)
5. North America 124,000 square kilometers (47,877 square miles)
6. Arctic Islands (not including the Greenland Ice Sheet)275,500 square kilometers (106,371 square miles)
Note: You have to link all the email addresses in the lab! See doc in documents
Activity: Ice Cores: Unlocking Past Climates
Module 1: Climate and Ice Video
Climate and Ice Overview Lesson Plans
Overview Part I of this lesson begins with a video that explains the difference between weather and climate, describes glacier formation, and identifies the types of information that can be found in the glacial record. The video is followed by an exploration of current weather conditions at various locations around the world. The locations represent a variety of climate types and each is located near a glacier or ice sheet. Students then differentiate between weather and climate and examine climate data for their location. In Part II students visit websites to learn what glaciers are and how they are formed. Students conduct additional internet research in Part III to discover what types of substances can be trapped in glaciers. In the final activity students locate a glacier or ice sheet closest to the city they collected weather data for and create a model that tells the story of several years in the life of their glacier. The story includes weather information and information about any natural or human-induced events that contributed materials to the glacier’s record.
Content Objectives Students will
Differentiate between weather and climate
Investigate how glaciers are formed and where they are found
Build a glacier model that illustrates several years of the glacial record Grade Level: 5-8 Suggested Time: 2-3 class periods Multimedia Resources
[link to video] http://www.wunderground.com/
http://www.weatherbase.com
The Life Cycle of a Glacier, http://www.pbs.org/wgbh/nova/vinson/glac-flash.html
How Glaciers Work, http://science.howstuffworks.com/glacier.htm
Glacier Formation, http://science.howstuffworks.com/glacier1.htm.
Glaciers and Icecaps: Storehouses of Freshwater, http://ga.water.usgs.gov/edu/earthglacier.html
Stories in Ice, http://www.pbs.org/wgbh/nova/warnings/stories/
Ice Core Timeline, http://www.pbs.org/wgbh/nova/warnings/stories/icecore.html
Paleoclimatology: The Ice Core Record, http://earthobservatory.nasa.gov/Features/Paleoclimatology_IceCores/
Why Study Ice Cores?, http://nicl.usgs.gov/why.htm
Ice Cores Reveal Fluctuations In Earth's Greenhouse Gases, http://www.sciencedaily.com/releases/2008/05/080514131131.htm
Deep ice tells long climate story, http://news.bbc.co.uk/2/hi/science/nature/5314592.stm
Glaciers, Ice Sheets, and Climate Change, http://www.waterencyclopedia.com/Ge-Hy/GlaciersIce-Sheets-and-Climate-Change.html
Materials:
Clear, colorless container for glacier models, e.g. plastic food containers, large disposable plastic cups Various materials to represent snow and ice in the glacier model, e.g. shredded paper, rice, marshmallows, shredded foam rubber
Various materials to represent dust, pollen, volcanic ash, etc., e.g. coffee grounds, colored sugar, confetti
Suggested locations:
These locations have been selected due to their proximity to a major glacier or ice sheet and the variety of climates they represent.
Location Nearest Glacier/Ice Sheet Climate Type
Santa Barbara, CA Palisade Glacier is the largest glacier in the Sierra Nevada coastal climate
Idaho Falls, ID Fremont Glacier, Wyoming semiarid alpine climate La Paz, Bolivia Quelccaya Ice Cap, Andes Mountains subtropical highland Lhasa, Tibet Tibet plateau arid alpine
Mombasa, Kenya Kilimanjaro Glacier warm tropical Danmark Havn (Danmarkshavn), Greenland Greenland ice sheet tundra
Procedures Part I: What’s the difference between weather and climate?
1. Engage students in the topic by showing the Climate and Ice video
a. Before showing the video engage students in a conversation about the weather. This could be as simple as asking them how they like today’s weather to something more expansive like asking them about dramatic weather events they remember, how they could find out what the weather was like on the day they were born, or asking them to describe the weather on a perfect day.
b. During the video ask students to note things they would like to learn more about.
c. After showing the video ask students what topics from the video they would like to learn more about. Develop a class list as students are sharing. Highlight topics that will be addressed throughout this lesson. Follow up and transition to the next step by asking students to share their current understanding of the difference between weather and climate. This sharing could be done as a journal entry, a Think-Pair-Share, or any other strategy that requires students to clearly express their current thinking about weather and climate.
2. Discuss the following questions with the whole class.
a. Where would you go to find out what tomorrow’s weather will be?
b. What does a weather forecast tell us? (temperature, precipitation, barometric pressure, wind speed)
c. How far into the future can we typically predict the weather? (5-7 days) d. Where would you go if you wanted to find out what the weather was like last year at this time? What about 100 years ago? Or 1000 years ago?
3. Transition to the next step by telling students that together you are going to explore the current weather around the world, global climate, glaciers, and how glaciers help us understand what the climate was like long ago.
4. Organize students into groups. Assign each group one of the suggested locations. Each group will go to http://www.wunderground.com/ or similar sites to find the following information for their assigned location:
a. Current weather
i. Temperature
ii. Precipitation
iii. Barometric pressure
iv. Wind speed
b. Next day’s predicted weather
c. Record high and low temperature, and when the record was set d. Locate the site on a world map.
5. Ask each group to report to the class. They should indicate where their location is on a world map and share their findings. As a class, discuss the similarities and differences in the weather for each site. Identify the longest held record and ask students to think about ways scientists can learn about environmental conditions that happened before this record began.
6. Define climate and differentiate between weather and climate. Replay the portion of the video that distinguishes between weather and climate.
7. Ask each group to go to www.weatherbase.com and search for their location. After finding the data for their location, each group should examine the average high and low temperatures and average precipitation for their location. Groups should then describe the climate of their location and explain how the current weather makes sense within the larger view of climate.
a. Guiding Questions
i. How many years on record were used in determining the averages for your site?
ii. What is the average high temperature? In what month did it occur?
iii. What is the average low temperature? In what month did it occur?
iv. What is the average annual precipitation?
v. Describe the pattern of the precipitation. Is there a wet and dry season, or is the precipitation fairly constant throughout the year?
vi. Describe the climate for your location.
vii. Does the current weather for your location make sense based on your climate description?
8. Ask the students to think about ways we can find out about weather conditions and climate prior to human record keeping. Refer back to the Climate and Ice video. If necessary guide them to glaciers as a source of long ago climate data.
Part II: What is a glacier?
1. Begin by asking students to share their current thinking about glaciers, how they form, and where they might be found. This can be done through discussion, journaling, wiki entries, etc.
2. Have groups of students investigate the following sites to learn some fundamentals about glaciers.
a. The Life Cycle of a Glacier, http://www.pbs.org/wgbh/nova/vinson/glac-flash.html
b. How Glaciers Work, http://science.howstuffworks.com/glacier.htm, and the next page, Glacier Formation, http://science.howstuffworks.com/glacier1.htm.
c. Glaciers and Icecaps: Storehouses of Freshwater http://ga.water.usgs.gov/edu/earthglacier.html
3. Ask each group to share what they have learned. As a class, develop a description of how glaciers form, what happens to glaciers during warm weather, and where they are found in the world.
Part III: What do glaciers record?
1. Conduct a webquest to determine what types of substances can be trapped in glaciers. Include the following sites in the webquest:
a. Stories in Ice, http://www.pbs.org/wgbh/nova/warnings/stories/
b. Ice Core Timeline, http://www.pbs.org/wgbh/nova/warnings/stories/icecore.html
c. Paleoclimatology: The Ice Core Record, http://earthobservatory.nasa.gov/Features/Paleoclimatology_IceCores/
d. Why Study Ice Cores?, http://nicl.usgs.gov/why.htm
e. Ice Cores Reveal Fluctuations In Earth's Greenhouse Gases, http://www.sciencedaily.com/releases/2008/05/080514131131.htm
f. Deep ice tells long climate story, http://news.bbc.co.uk/2/hi/science/nature/5314592.stm g. Glaciers, Ice Sheets, and Climate Change, http://www.waterencyclopedia.com/GeHy/Glaciers-Ice-Sheets-and-Climate-Change.html
2. Create a class list of substances that can be trapped in glaciers.
3. Ask each team to locate the glacier or ice sheet nearest the location they used for their weather data. After locating the nearest glacier, students should write a hypothetical story that might be revealed by examining a few layers of their glacier. The story should reflect the surrounding area and events that might logically have happened.
a. Guiding Questions:
i. Was each year wet or dry?
ii. Did any natural events occur (e.g. volcanic eruption, forest fire) that might have resulted in substances being trapped in the glacier?
iii. Did any human-generated events occur (e.g. industrial accident, nuclear testing) that might have resulted in substances being trapped in the glacier?
4. Ask each group to use the materials available to them to construct a model of their glacier for the years they have described in their hypothetical story.
5. Ask each group to explore the models constructed by their classmates. As they explore the models, they should try to determine what conditions the model represents.
6. Wrap up by having each group present their models and stories to the entire class.
Additional content support for teachers: I Ice-core evidence of abrupt climate changes, http://www.pnas.org/content/97/4/1331.full
Video: Arctic Sea Ice Is Growing Younger and Thinner
The Arctic is Melting -So What?
datanuggets.org/2016/06/the-arctic-is-melting-so-what/
How does Sea Ice Form?
Kahoot (Preassessment
Kahoot (postassessment)
Arctic Ice Age (1987-2014) movie-scroll to bottom
New App to measure Sea Ice Levels: Polar Explorer:Sea Level
Can load on iphone or ipad
Polar Explorer OnLine Web browser
Overview of ContentPolar Explorer: SeaLevel provides maps, charts, text and audio to enable the user to address these questions:
Can load on iphone or ipad
Polar Explorer OnLine Web browser
Overview of ContentPolar Explorer: SeaLevel provides maps, charts, text and audio to enable the user to address these questions:
- What is sea level?
- Why does sea level change?
- What is the role of the ocean?
- What is the role of the atmosphere?
- What about contributions from glaciers?
- What about contributions from ice sheets?
- What about post-glacial rebound?
- Where is sea level changing now?
- What about polar regions?
- What about climate in the past?
- What about warm periods?
- What about cold periods?
- What about deglaciation 20,000 to 5,000 years ago?
- What are future predictions along the US coast?
