Messing About: Click on Scale of the Universe to see the large and small in our universe. In your ISN write a response to what you just witnessed.
STARS
Characteristics of Stars
Day 1: Activity: Colors of Stars
I will place a burning candle on your table top. Use the next blank page in your ISN and draw a picture of the candle flame. Use colored pencils to represent the colors you see in your candle flame. Answer these 2 questions under your drawing:
1. Which part of the flame do you think is the hottest? Why?
2. As you watch the candle flame, what similar things or events in everyday life have the same coloration?
Activity-Depending on Weather: Scale Size and Colors of Stars
Using the scale model (based on your handout calculations) for 7 different sized stars go outside and model, using string, the diameter for each
Activity: Your teacher will give you a 3x5 index card. Please write for 2.5 minutes on what physical processes they think are going on inside a star like our Sun and why you think it appears to us as a yellow star. Grammar, punctuation, spelling do not count. Drawing is fine. You may ask for more index cards.
Activity: After watching the Characteristics of Stars PPT Complete the Characteristics of Stars PPT Worksheet and do the Characteristics of Stars Review and Reinforce
Day 2: Activity: Watch the YourTube Video called: Glow On: A Crash Course about Absolute and Apparent Brightness and complete the Star Magnitude Workwheets.
Activity: After watching complete the Star Magnitude worksheets.
Day 3: Activity: Paralax Lab link to Schoology Assignment
Day 4: Activity: Properties of Stars H-R Diagram
Lives of Stars
DAY 5:
Knowledge Probe: Go to Lives of Stars-A Play: An Interview with a White Dwarf.
Activity: Complete the Evaluation Questions about what you learned reading and acting out the play. (Fill out the data table as the play progresses)
Stars and Galaxies
DAY 6:
Knowledge Probe:
Watch these two videos, the first is called, " Stars and Galaxies: The Hertzsprung-Russell Diagram, the second is called, ""the Hertzsprung-Russel Diagram and Stellular Evolution Create a google doc and answer the following questions after watching the video.
When done submit your google doc into the Schoology Assignment.
Please answer the following questions using a black font. Copy the question and then answer the question in a space below the question. Use complete sentences when providing your answer.
1. Explain the difference between temperature and heat.
Use examples to further explain the differences.
2. How does heat flow from one object to another?
3. Why does a large compost heap produce more energy than a campfire?
4. How can the surface temperature of a star be determined?
5. Why is Betelgeuse's luminosity more that Procyon's?
6. When you compare a star's luminosity to its surface temperature what can you learn about a star?
7. Why do you think the H-R Diagram is called the Periodic Table of Astronomy?
8. Where are the brightest stars located on the H-R Diagram?
9. When a star's luminosity is to 102 to 103 how much more luminosity does a star have? From 102 to 104 ?
10. What color are the hottest stars? the coolest stars?
11. Where are most stars located on the H-R Diagram?
12. What is the difference between the density of the Sun and the density of Betelgeuse?
13. What is the difference between a red supergiant and a blue supergiant? Why are they different?
14. Why is the average blue supergiant smaller than the average red supergiant?
DAY 7 and 8:
Knowledge Probe:
Watch the movie, Star Formation and Explosion :Life Cycle of a Star (Documentary)
While watching the movie take Cornell Notes on the information you hear during the movie. Plan to share out one discovery you made while watching the movie with your classmates. Use this Google Doc called Cornell Notes to take your notes on.
DAY 8:
ACTIVITY: Complete the following Web Quest: The Life Cycle of Stars.
Or ACTIVITY: LIFE CYCLE OF A STAR WEB ACTIVITY
DAY 9:
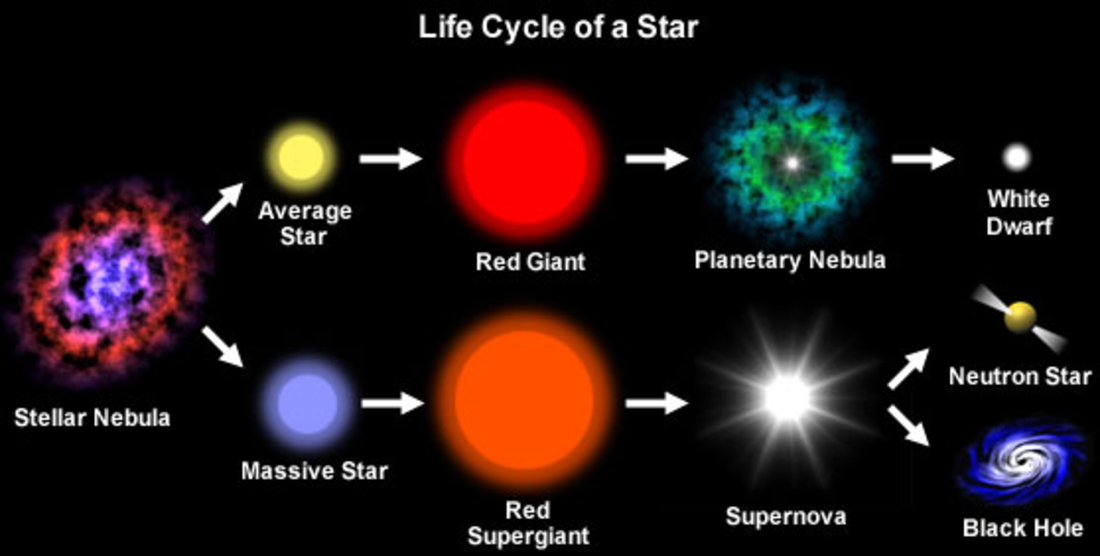
Activity: By drawing a diagram of the Life of a Star we will take notes about each event that happens in a stars life time. We will explain the life of an average star and a massive star and compare how each lives and dies. You will then use your knowledge of a stars life span to make a cartoon demonstrating the life span of any living organism of average size to massive size from it's birth to it's death. Be prepared to share your drawings with class. USE COLOR in your drawing.
DAY 10-12 Astronomy - Life Cycle of Stars Project
Pick a star and research its lifespan. You will investigate the birth to death of a particular star.
Essential Question: How do stars evolve or change over time?
Resource: How do stars form and what are their lives like depending on their size? (use this slide to
answer question 9 and 10 and 11 below)
Curiosity: Watch some of the Top 100 images from the Hubble Space Telescope. In your ISN write 3 question you may have as you look
at the images.
Personal Knowledge: In your ISN write "Personal Knowledge" at the top of the page. For 5 minutes write about any information you have
about stars and star life cycles. We will share with our tables one important piece of information no one else talked about. Then we will share out with the class.
ACTIVITY: You will be given one sheet of copy paper. Write A-L down the left side and M-Z down the middle. Each table group will write a word or short phrase that connects to their prior knowledge of stars and the star cycle for each letter of the alphabet.
Investigation Plan: Each student will be assigned a star. All information about that star must be researched.
The goal is to produce a PowerPoint /mini poster/Google Slide presentation that describes the life-cycle of the assigned star.
Your slide/mini poster will be presented to the class and plotted on a large H-R Diagram on Google Sheets (see below). After
all presentations, and an all class activity, it will become obvious from the projects about how stars differ and evolve.
Each investigation will contain the following information: •
1. Title - Name of the Star •
2. Spectral Class/Luminosity Class and a description of the star (stage of evolution the star is presently in: Main Sequence, Giant, Supergiant, or White Dwarf) •
3. Mass of the star compared to the Sun (solar masses)
4. Luminosity (compared to the Sun)
5. Temperature (˚K)
6. Size of the star compared to the Sun - diagram/image to show size vs. Sun (top right of slide)
7. Plotted location of the star on an HR Diagram
8. Age of the star - if known
9. How did your star form?
10. How long it takes the star to go through all of its life stages - estimate
11. Stages of evolution the star goes through based on mass
12. Radius of your star
13. Constellation-if any
14 Any other important or unique information you think would help to understand your assigned star.
References cited - You may use Wikipedia as a guide to get some background/basic information, but you must include 2 addition sources. To get
you started, here are a few you can consider (but go ahead and search yourself):
Solstation.com http://www.solstation.com/stars.htm
The Bright Star Catalogue http://www.alcyone.de/SIT/bsc/bsc.html
http://www.alcyone.de/brightest_stars.html
Atlas of the Universe
www.atlasoftheuniverse.com/nearstar.html
http://www.atlasoftheuniverse.com/12lys.html
On the bottom of this page, choose a star for your project. Some have more information than others, but the most important information to find on your star is the spectral class/luminosity class, mass, luminosity, temperature, and radius.
• Plotting your star on the HR Diagram will help you understand the nature of your star.
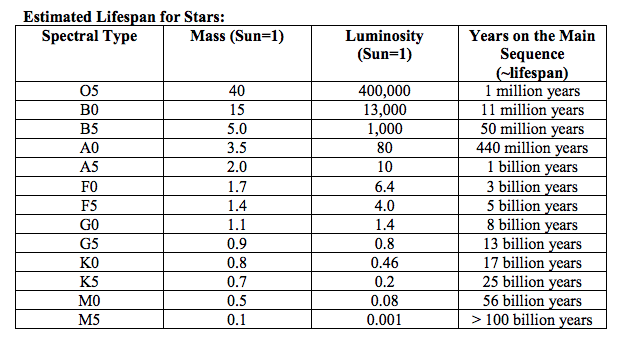
• Use the table provided to estimate the age of your star IF your research comes up empty.
Stars to Consider:
AD Leonis Barnard’s Star Gliese 581 Regulus Aldeberan Betelguese Gliese 710
Rigel Algol A Canopus LHS 292 Sirius Alnitak Capella Mintaka
Sirius B Alpha Centauri A Deneb Mira Spica Alpha Centauri B Denebola
Polaris Tau Ceti Alsafi Epsilon Eridani Pollux Van Maanen’s Star Altair
Eta Canis Majoris Procyon Vega Antares Eta Carina Procyon B VY Canis Majoris
Arcturus Fomalaut Proxima Centauri Wolf 359
Remember: MASS determines how long a star will “burn” hydrogen on the Main Sequence and the eventual fate of the star. Low mass stars have about 8 solar masses or less; high mass stars have about 8 solar masses or more when they leave the Main Sequence
docs.google.com/spreadsheets/d/1VYJQMJRYSaq1Ta2c4Yd7exH4tnEVq9pQ9ZSYUg5kgo0/edit#gid=0
OBSERVATIONS AND DATA ANALYSIS: Put the luminosity, temperature in Kelvin, the solar mass and the radius of your star on this data Google Sheet. When everyone has entered the data make the following graphs.
1. Plot the luminosity and temperature for each star (thus making an H-R Diagram)
2. Compare the Solar Mass and temperature for each star.
3. Make a Claim, Evidence, and Reasoning for each graph Put this on a separate Google Sheet and submit into this schoology asignment.
Put these graphs into this Schoology Assignment
Using large poster board or a 3-tab poster present the following information:
Explanation: Claim, Evidence, and Reasoning (CER)
CLAIM: Make a statement about how your star began and will change over time.
EVIDENCE: Use the 2 graphs you made as your scientific data to will support your claim. Your answers to the investigation questions and the graphs will be used as evidence in this investigation.
REASONING: This is the argument used to determine why your data supports the statement about how your star evolved or changed over time. Use your personal prior knowledge about star formation and evolution and any other scientific explanations or theories that can be used to describe why stars do what they do.
CER for the Sun: This is an example of what I am looking for when you do your CER for your star:
CER of Sun
Schoology Rubric for CER
Activity: Read the article: Observation of neutron star collision called a game changer in astronomy. Write a summary of this article and submit it in Schoology
|
DAY 13: STAR IN A BOX INTERACTIVE ACTIVITY STAR IN A BOX ACTIVITY LAB: Google Doc: Star in a Box Activity Questions. Click on to the questions and make a copy for yourself to answer the questions. When done submit a link to your answers in this Schoology Assignment. ACTIVITY: NEWSLEA ARTICLE: In a galaxy far, far away, astronomers capture first images of a black hole TED TALKS: Inside the Black Hole Image that Made History |
