What is Weather TpT. Google Slide
Phase Changes
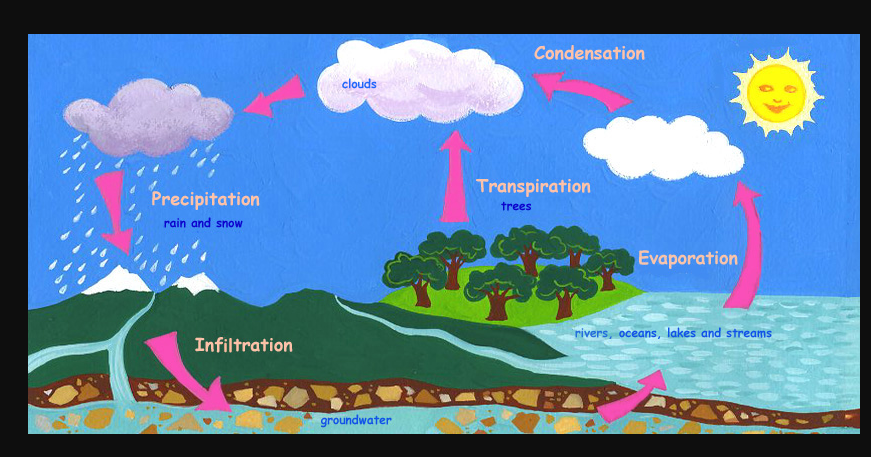
The Water Cycle
Essential Question: How does the Water Cycle effect your life?
Day 1 Activity 1: Watch this Water Cycle Terms PPT and take appropriate notes on your worksheet.
Activity 2: Draw a picture of the Water Cycle using 2 pages of your Interactive Science Notebook (ISN). Label the 10 vocabulary words you learned in the vocabulary and the PPT notes. COLOR your picture. I have provided a picture but some terms are not on it. You should have all 10 vocabulary words on your picture though. The vocabulary words for the water cycle are: evaporation, condensation, precipitation, run off, ground water, transpiration. Locate an area in your drawing to label saturation, porosity, absorption and permeability. Put a one sentence definition by each term. Example: evaporation: liquid water changes to a gas
Activity 3: Complete this Schoology Assignment:
You will get all of the points possible for this assignment if you attempt each question with a logical answer. You can not write IDK.
Copy the questions below on a google doc. Type the answer you feel is appropriate. Write your NAME/Water Questions as the title of the doc. Then copy the link and share it in this Schoology Assignment link.
1. What makes our planet unique?
2. Why is it important to know about and take care of our water on Earth?
3. Where is most water found on Earth?
4. Why can't or shouldn't we drink water from the ocean?
5. What is the driving force of the water cycle?
BELOW IS A PICTURE YOU CAN USE. NOTE: IT DOES NOT HAVE ALL THE VOCABULARY WORDS. THE ONES MISSING STILL NEED TO BE ADDED BY YOU.
|
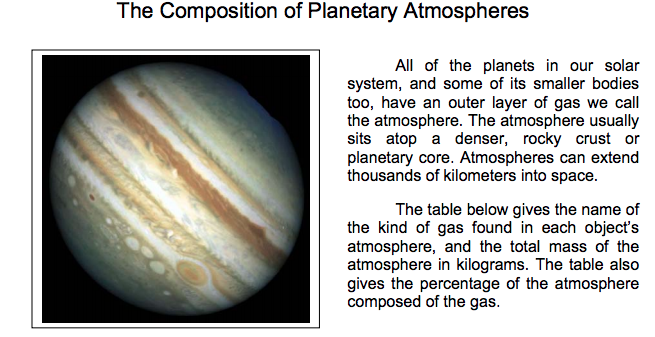
Gasses in the Atmosphere: Activity 1: Make a Pie Chart
|
Atmosphere: Essential Question:
|
Open a Google Sheet. Copy the air gas % (Nitrogen to Other) information below. Paste it into Google Sheets and create a Pie graph with a title (see below) and all gas types named along with the amounts of gas present in our atmosphere. You can use the whole gas name or the Chemical abbreviation. Put the name of the gas in the A column and the number amount in the B column. Do NOT put a percentage-% in that column. Copy and past it and the answers to the questions below into Schoology.
IMPORTANT READ: Copy these question in your Google Sheet. Type in your answers before submitting all into this Schoolgy assignment.
1. What are the 4 most common gases in dry air?
2. What are 3 ways in which the atmosphere is important to life on Earth?
3. How would the amount of carbon dioxide in the atmosphere change if there were no plants?
4. How would Earth be diffferent without the atmosphere?
Title: Composition of Dry Air Substance % by volume
Nitrogen, N2 78.08%
Oxygen, O2 20.95%
Argon, Ar 0.93%
Carbon dioxide, CO2 0.033%
Other (See Below), .03%
(You only have to graph .03%. I just wanted you to know what that low percentage consisted of)
Helium, He 0.00052%
Methane, CH4 0.0002%
Krypton, Kr 0.00011%
Nitrogen(I) oxide, N2O 0.00005%
Hydrogen, H2 0.00005%
Xenon, Xe 0.0000087%
Ozone, O3 0.000001%
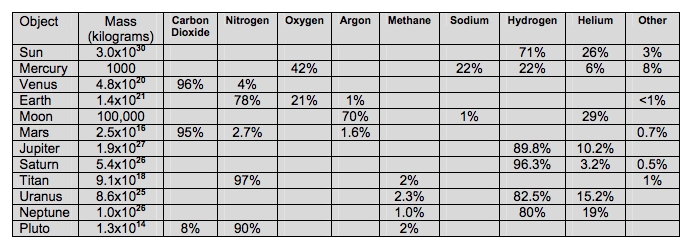
Activity 1: Using Google Sheets that you have already started add the following PIE GRAPHS to that assignment. When done submit your completed Google Sheet (includes answers to any questions) into this Schoology Assignment
Problem 1 – Create a pie graph (circle graph) that shows the atmosphere constituents for Mars.
Put the graph you have already done of Earth next to this graph.
Problem 2 – Create a pie graph that shows the percentage of Nitrogen for Venus, Earth, Mars, Titan and Pluto.
QUESTIONS: Copy these questions on the Google Sheet and submit into the Schoology Assignment above.
1. Which planet has the atmosphere with the greatest percentage of Oxygen?
2. Which planet has the atmosphere with the greatest number of kilograms of oxygen?
3. Compare and contrast the objects with the greatest percentage of hydrogen, and the least percentage of hydrogen.
The Facts About Ozone
|
Modeling how CFC's deplete the ozone layer Lab
ACTIVITY: Read all about Ozone here then complete the worksheet. Have me sign it when you are finished. ACTIVITY: Create an OZONE POLLUTION BROCHURE |
Relative Humidity
Look at the Relative Humidity Lab worksheet. As you read each question (see below and on your worksheet) watch the associated video and then write your responses on your paper worksheet.
Answer the following 4 question (you will be linked to a YouTube site for each). You have 3-5 minutes for each question. The only wrong answers will be blank responses and IDK answers. Try your best! Think outside the box:) NOTE: THESE QUESTIONS ARE ALSO ON THE PAPER VERSION OF THE LAB!!
What do you Know about Humidity? Why is it so humid in Michigan?
How do you think temperature affects humidity? Will a golf ball fly farther in a higher or lower temperature?
What do you know about dew point? If dew point goes up what kind of day will we have?
What do you know about Relative Humidity?
How are relative humidity and dew point related?
Investigation: Find 6 areas in school that are either hotter or colder than most. You and your team will go to that site and measure the air temperature first to get your dry bulb reading. Record this amount. Then you will dip the cotton of your constructed psychrometer and begin fanning the bulb to allow evaporation to occur quickly. After 5 minutes of vigorous fanning record your wet bulb temperature. Record this amount. Come back to class and share your data on this Google Sheet. Compute the Relative Humidity for each site. Copy this data and create a graph of dry bulb temperature vs. relative humidity.
Finally, answers the questions on your Relative Humidity Lab Worksheet
Weather Symbols:
Complete this Weather Map Gizmo 4th hour Weather Map Gizmo 2nd Hour
SEVERE WEATHER:
1: Weather 101 - YouTube
2: How A Thunderstorm Is Formed
3: What Causes Thunder And Lightning?
4: Lightning 101
5: Hurricanes 101 - YouTube
6: Tornadoes 101 - YouTube
Question/Answer: Have students answer the following questions and discuss as a class.
What controls most of the Earth's weather? Why? (Answer: The sun; areas close to the equator receive more energy from the sun than those closer to the Earth's poles and within those areas, the various surfaces [such as oceans, forests, deserts, etc.] have different abilities to soak up the sun's rays. The resulting temperatures have the biggest affect on the Earth's weather.)
Does human activity impact the weather? How? (Answer: Humans can impact the weather through agriculture, industry and even everyday use of cars and electricity.)
Does the impact of human activity really make a difference? (Answer: Human effects, such as acid rain and greenhouse gases, can lead to extreme weather, such as drought, flooding and storms.)
Earth Networks
Explore the Basic Weather Facts
Weather 101 Resources
Video and worksheets for all weather factors-check it out!
Explore the Basic Weather Facts
Weather 101 Resources
Video and worksheets for all weather factors-check it out!
